Infographics that earn backlinks are gold in the world of digital marketing. At Emplibot, we’ve seen firsthand how powerful data-driven visuals can be for attracting high-quality links and boosting SEO.
In this post, we’ll show you how to create AI-generated infographics that not only look great but also drive real results for your link building efforts. Get ready to transform your content strategy with eye-catching, fact-based visuals that demand attention and shares.
What Data-Driven Content Earns Links in 2025?
The link-building landscape has evolved dramatically in 2025. Key types of data-driven content consistently earn high-quality backlinks. Let’s explore these powerful formats that will supercharge your link-building strategy.
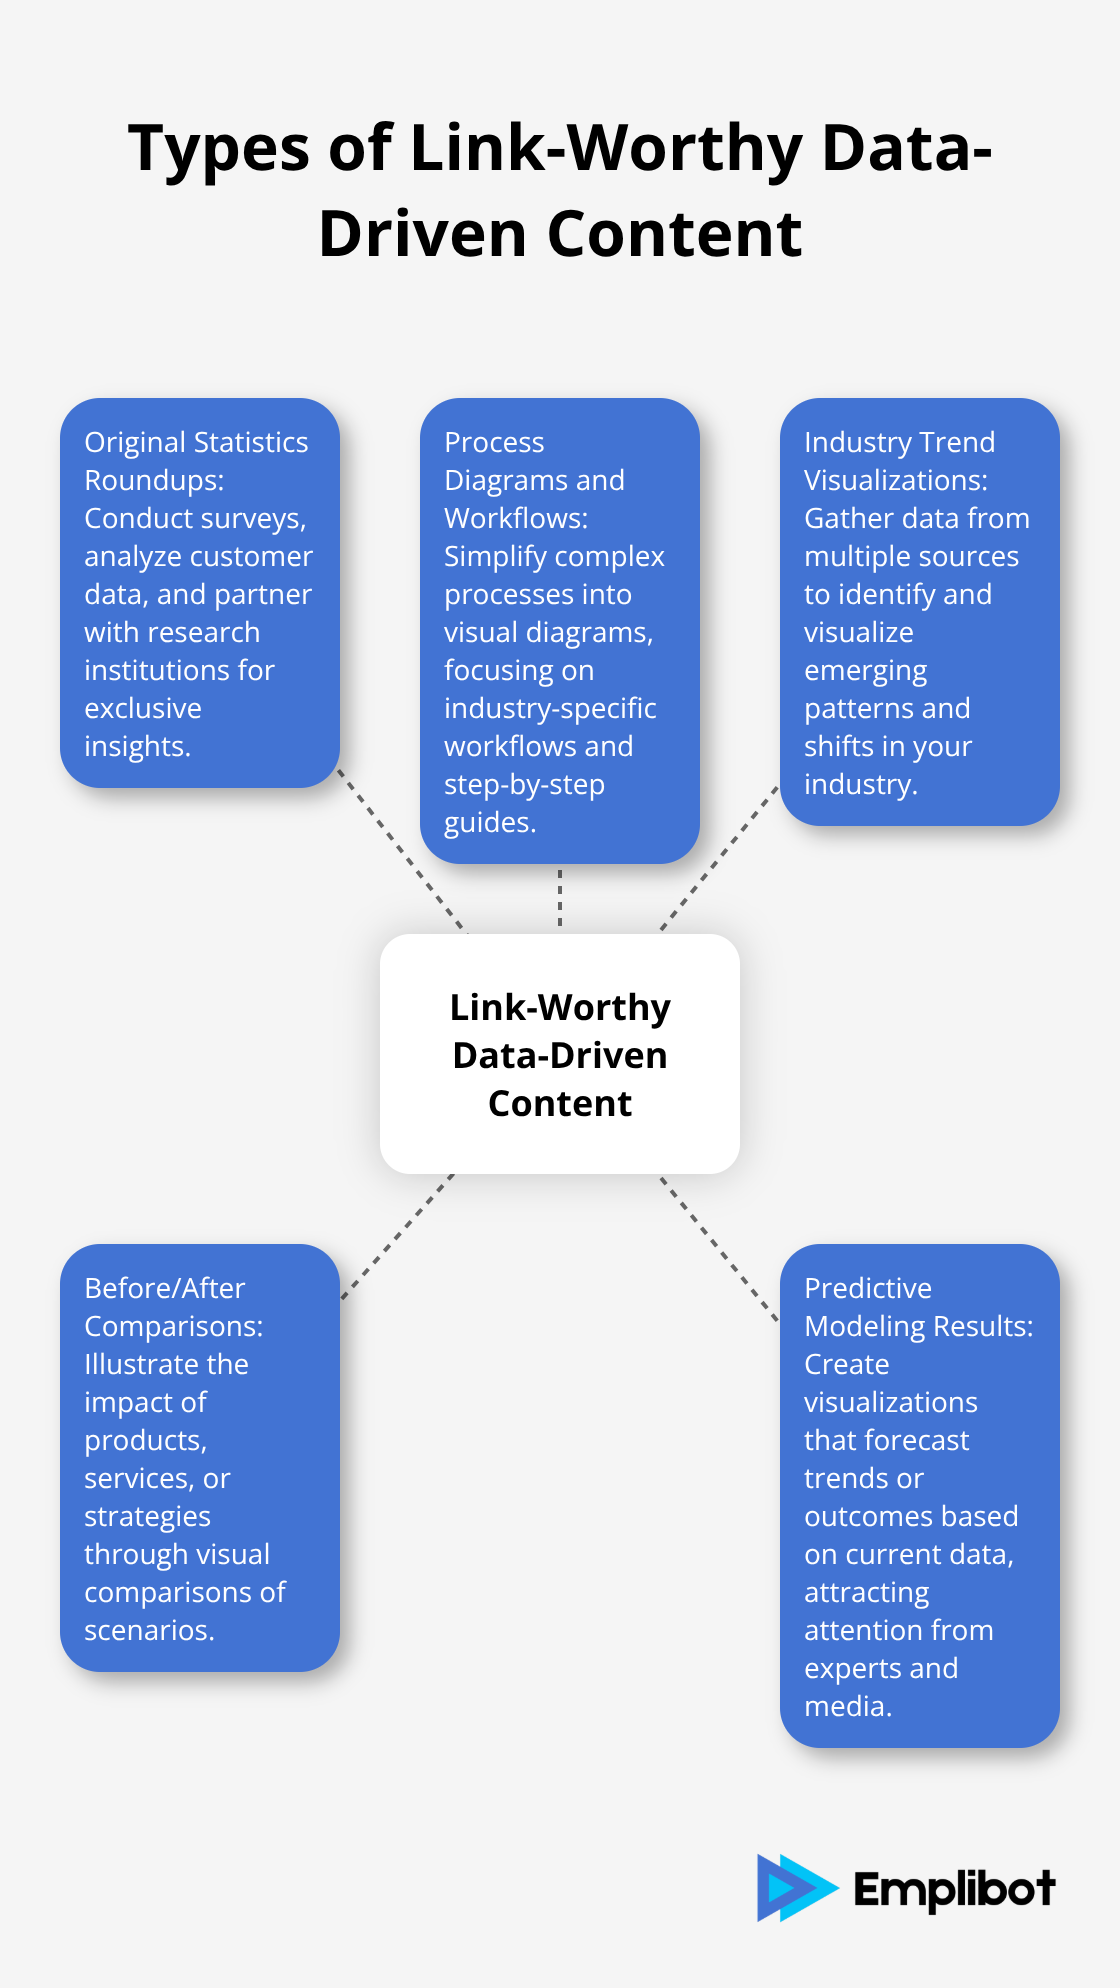
Original Statistics Roundups
Original research and data are among the most valuable content types for link building. To create a compelling statistics roundup:
- Conduct surveys within your industry
- Analyze your own customer data (anonymized, of course)
- Partner with research institutions for exclusive insights
Present your findings in easy-to-digest formats. Journalists and bloggers love to cite fresh, authoritative data in their articles.
Process Diagrams and Workflows
Complex processes simplified into visual diagrams attract links. They provide immense value by making difficult concepts easy to understand. A great example is the periodic table of SEO factors by Search Engine Land, which has garnered thousands of backlinks over the years.
When you create process diagrams:
- Focus on industry-specific workflows
- Break down complex marketing or business strategies
- Visualize step-by-step guides for common tasks in your field
Make your diagrams easily shareable and embeddable to maximize their link potential.
Industry Trend Visualizations
Businesses must stay ahead of industry trends. Visualizing these trends provides valuable insights and creates highly linkable assets. The Content Marketing Institute’s annual reports are prime examples of trend visualizations that consistently earn backlinks.
To create impactful trend visualizations:
- Gather data from multiple authoritative sources
- Identify emerging patterns and shifts in your industry
- Use compelling visuals like line graphs, heat maps, or interactive charts
Present this information in an easily digestible format to give other content creators a reason to link to your work as a reference point.
Before/After Comparisons
Visual comparisons of “before and after” scenarios are powerful link magnets. They illustrate the impact of a product, service, or strategy in a clear, compelling way. These comparisons are particularly effective in industries like marketing, technology, and design.
Try to create before/after comparisons that:
- Showcase real-world results (with client permission)
- Highlight industry transformations over time
- Demonstrate the effects of implementing best practices
These visuals not only earn links but also serve as persuasive marketing tools.
Predictive Modeling Results
As data science advances, predictive modeling has become a valuable source of linkable content. Visualizations that forecast trends or outcomes based on current data attract attention from industry experts and media outlets.
To create compelling predictive modeling visuals:
- Use reliable data sources and transparent methodologies
- Focus on predictions relevant to your industry
- Update your models regularly to maintain accuracy and relevance
These forward-looking insights provide a unique perspective that others will want to reference and link to.
The next step in creating link-worthy infographics is to ensure the credibility of your data. Let’s explore how to source and fact-check your information effectively.
How to Source and Verify Data for Trustworthy Infographics
Identify Authoritative Data Sources
The creation of link-worthy infographics starts with accurate, reliable data. Select 5-10 reputable sources for your information. Government agencies (e.g., U.S. Bureau of Labor Statistics), academic institutions, and industry-leading research firms (such as Pew Research Center and Gartner) provide excellent starting points. These organizations are known for their rigorous methodologies and comprehensive datasets.
When you choose sources, evaluate their reputation, methodology, and the recency of their data. Try to include a mix of established sources and emerging research firms to offer a balanced perspective.
Verify Statistics Through Multiple Channels
After you gather initial data, verify the statistics through multiple channels. This process helps you catch discrepancies and ensures the accuracy of your infographic.
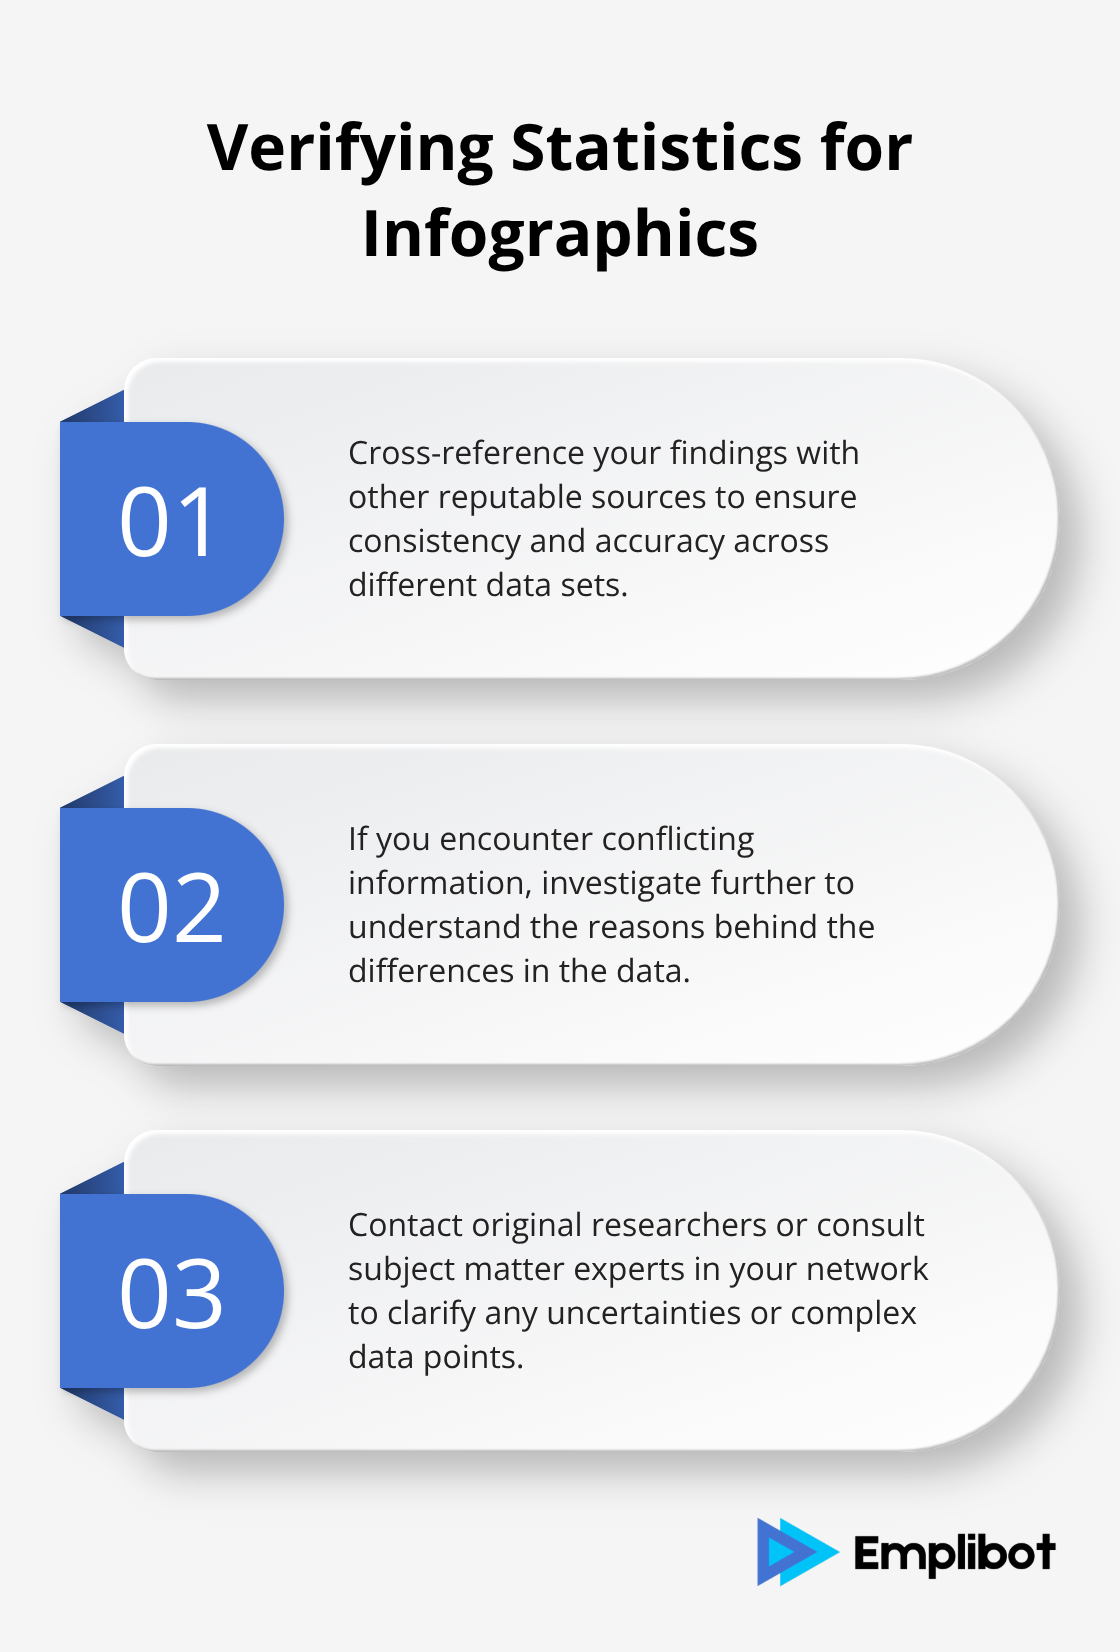
Cross-reference your findings with other reputable sources. If you encounter conflicting information, investigate further to understand the reasons behind the differences. This might involve contacting the original researchers or consulting subject matter experts in your network.
Implement Robust Citation Practices
Proper citation builds credibility for your infographics. Include source attributions directly within your graphic, typically in a footer or alongside the relevant data points. This transparency builds trust with your audience and facilitates easy verification of your information.
Provide full references in the accompanying text of your blog post or landing page (in addition to in-graphic citations). This allows for more detailed attribution and gives credit where it’s due. In APA style, you should italicize the titles of standalone works and periodicals.
Use Automated Verification Tools
Streamline the fact-checking process with automated verification tools. These tools can flag potential inaccuracies and save time in the research phase. Factmata and Full Fact’s automated fact-checking systems are valuable additions to your workflow.
Remember that while these tools are helpful, they should complement (not replace) human judgment. Always review the results critically and use them as a starting point for further investigation.
Establish a Peer Review Process
Implement a peer review process to add an extra layer of verification to your infographics. Have colleagues or industry experts review your data and visualizations before publication. This step can help identify any overlooked errors or biases in your presentation of information.
Encourage reviewers to challenge assumptions and question data interpretations. This collaborative approach strengthens the overall quality and credibility of your infographics.
The next step in creating compelling infographics involves translating this verified data into visually striking designs that capture attention and drive engagement. Let’s explore the design principles that will make your infographics stand out and earn those valuable backlinks.
How to Design Infographics That Captivate and Convert
Creating visually stunning infographics combines data presentation with aesthetic appeal. We’ll explore how to craft infographics that look great, drive engagement, and earn those coveted backlinks.
Establish a Clear Visual Hierarchy
An effective infographic guides the viewer’s eye through the information in a logical sequence. Start with a bold headline that clearly states the main takeaway. Use size, color, and positioning to emphasize key data points. A study by Nielsen Norman Group found that users typically read web content in an F-shaped pattern, so place your most important elements along the top and left side of your infographic.
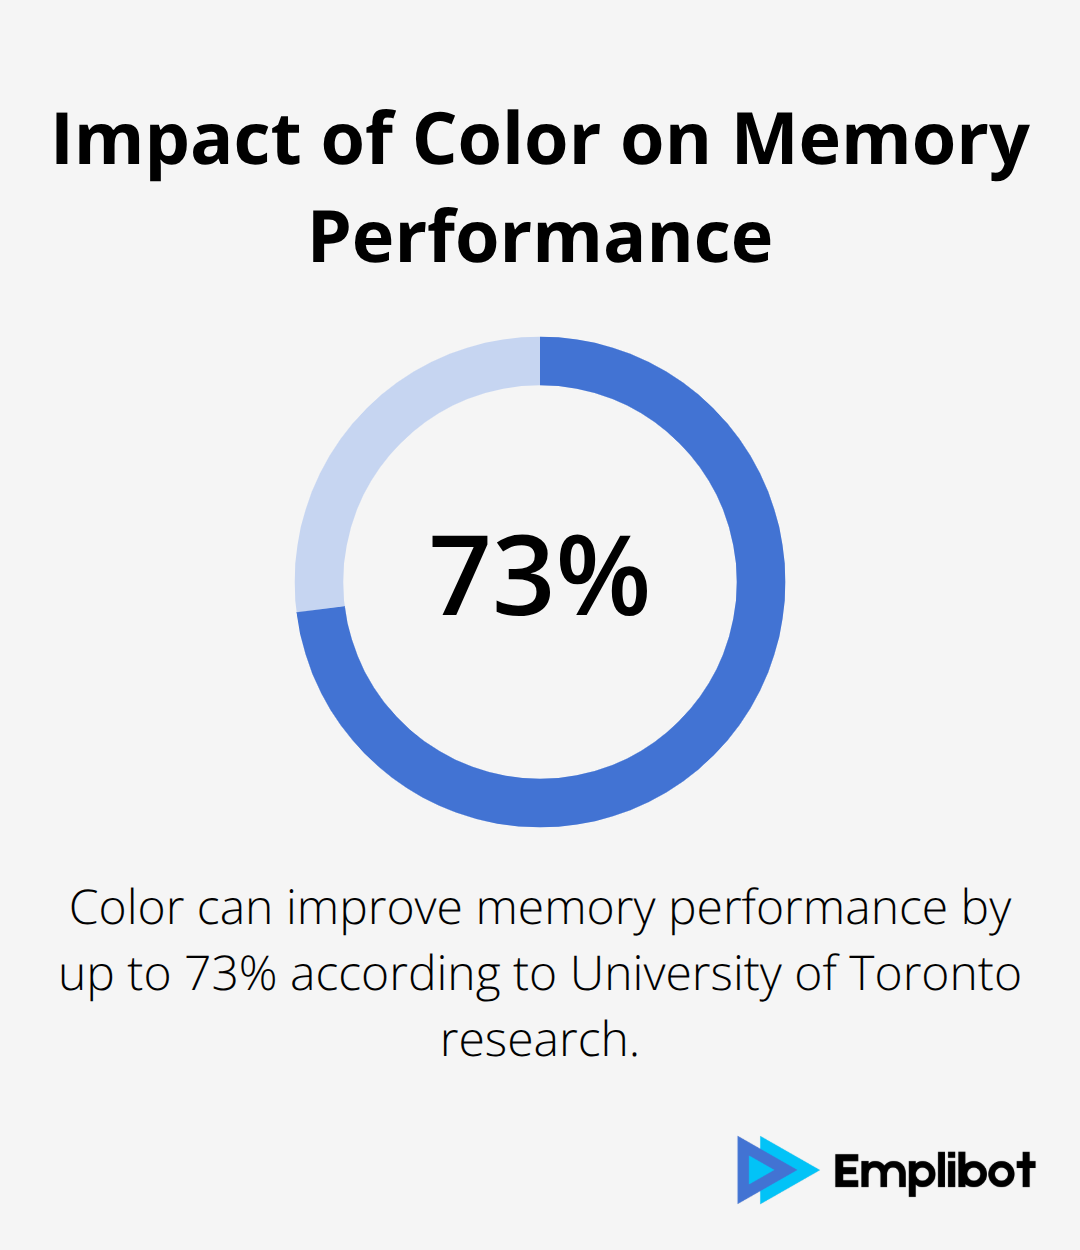
Master the Art of Color Psychology
Color choices can make or break your infographic’s effectiveness. Limit your palette to 3-5 colors that complement your brand and enhance readability. Research by the University of Toronto discovered that color can improve memory performance by up to 73%.
Use contrasting colors to highlight critical information, but be mindful of color-blind viewers. Tools like ColorBrewer can help you select color-blind friendly palettes that still pack a visual punch.
Leverage White Space for Clarity
Don’t underestimate the power of negative space in your infographic design. Proper use of white space can increase comprehension by up to 20% (according to a study in the Journal of Advertising Research). Give your content room to breathe by spacing elements generously. This improves readability and creates a more polished, professional look that’s more likely to attract high-quality backlinks.
Choose Appropriate Chart Types
Select the right type of chart or graph to represent your data effectively. Bar charts work well for comparisons, while line graphs excel at showing trends over time. Pie charts should be used sparingly (and only for parts of a whole). Infogram’s 2024 report on data visualization trends indicates that interactive charts increase engagement by 30% compared to static ones.
Ensure Cross-Device Readability
In today’s mobile-first world, your infographics must look great on all devices. Design with a mobile-first approach, ensuring that text is legible and graphics are clear on smaller screens. Test your infographics on various devices before publication. A responsive design can increase mobile sharing by up to 40% (Mobile Marketing Association, 2024).
The goal is to create infographics that effectively communicate your message and drive results. These design principles will help you create visuals that stand out in the crowded digital landscape and earn the backlinks your content deserves.
Final Thoughts
AI-generated infographics revolutionize link building strategies. Data-driven visuals attract high-quality backlinks naturally, combining accurate information with captivating design principles. Emplibot’s automated content creation platform helps businesses produce data-rich, visually appealing infographics that resonate with audiences and earn valuable backlinks.
Infographics that earn backlinks remain a powerful tool in content marketing. Original statistics, process diagrams, industry trends, and predictive modeling create infographics that inform and inspire others to link back. The credibility of data and effectiveness of design determine the success of your infographics.
Visual content will continue to grow in importance in the digital age. AI-generated infographics can elevate your link-building efforts to new heights. Create data-driven visuals today and watch your content attract the attention and backlinks it deserves.